

US spot Bitcoin ETFs draw over $1 billion in three sessions, yet Bitcoin price slips
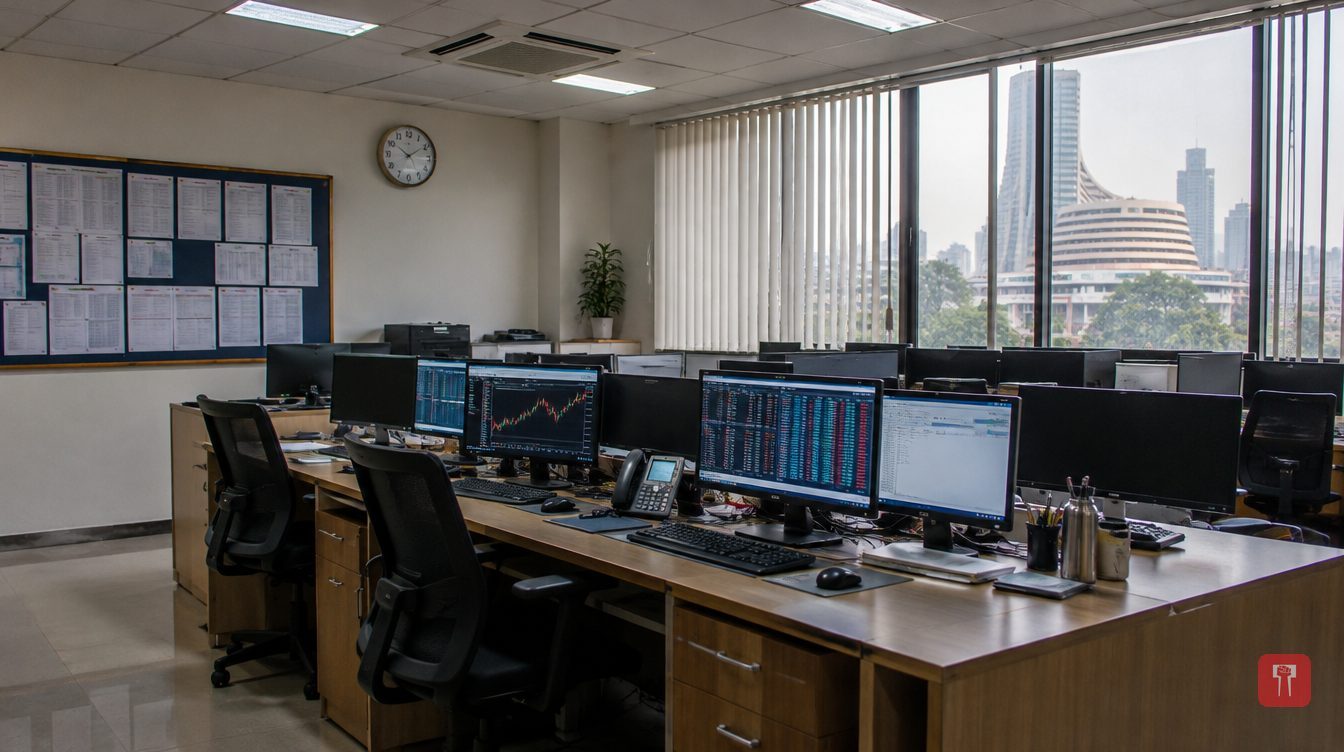 Images are not validated/verified
Net inflows of about $1.075 billion between October 19 and 21 did not stop Bitcoin falling below $83,000 in the Asian session on October 22.
US spot Bitcoin ETFs recorded net inflows of more than $1 billion over the three sessions from October 19 to 21. The fresh demand for the funds is among the most discussed topics in cryptocurrency news. But Bitcoin's price then moved lower, showing that rising inflows into funds and a sustained rise in price do not always go together.
The real question is how to read the two signals together. ETF inflows measure only demand that arrives through one particular channel. Bitcoin's price reflects the whole market, where this demand meets selling, shifting expectations and trades of different durations.
According to Farside Investors data, net inflows were $526.7 million on October 19, $23.2 million on October 20 and $524.8 million on October 21. Together the three days came to $1,074.7 million, or about $1.075 billion. Almost the entire sum thus came on two big days, with a very small positive day in between. It can therefore be called a return of demand, not a daily acceleration.
These figures cover a fixed period. They should not be matched against a three-day total that changes with every new US session. Keeping the dates alongside also makes it easier to compare reports published in different time zones.
On October 21, BlackRock's IBIT drew $235 million and Fidelity's FBTC $212.7 million. Together that was $447.7 million, about 85 per cent of the day's total net inflow. The rest came from other funds. This shows that a large number can be built from demand spread across many funds, or from activity concentrated in a few products. The IBIT and FBTC figures show where demand is appearing in the fund market, but they do not identify every investor or explain why each sum was put in. Institutional demand is part of this discussion, but total flows alone cannot separate institutional from retail investors.
The flow report is only one part of analysing Bitcoin. It shows net money coming into funds, not every Bitcoin trade or every bout of selling pressure. Turnover is a separate matter. Existing ETF units can trade heavily even if that much fresh money has not entered the fund. It is better to treat volume, net inflows and assets under management as three separate indicators so that the same activity is not counted twice. The value of a fund's assets can also rise without that much new investment if the price of what it holds goes up. India's NSE explains the role of unit creation and redemption in its technical guide.
On October 22, in the Asian session, Bitcoin fell below $83,000. Price can thus fall despite strong demand for funds. Selling elsewhere in the market, changes in leveraged trades or a lower appetite for risk can all neutralise fund demand. Flow figures alone cannot say what lay behind any move.
Indian readers also need a firm basis for comparison. BTC USD is Bitcoin's price in dollars, while the rupee price includes both the dollar rate and the USD/INR rate. A change in one does not mean the same percentage change in the other. Financial Benchmarks India has set out how it calculates its dollar-rupee benchmark. Using a dated currency reference helps avoid mistaking a rupee conversion effect for a fresh move in Bitcoin.
There is also a timing difference. Bitcoin's price is available round the clock, whereas US spot ETF flows are for completed US sessions. A flow figure from an earlier period may therefore be set beside an Asian-session price.
What remains to be seen is whether fresh investment continues and whether the price strengthens along with it. More positive sessions would add to the evidence of fund demand, while a lasting rise in price would be separate evidence that broader buying is absorbing the available supply. It would not be right to assume either outcome from the three-day total. Watching consecutive daily reports, the split between funds and Bitcoin's reaction over the same period gives a better picture than relying on any one big number.
Reach readers on the ward they actually live in.
Advertise with Prime Time 24Reach readers on the ward they actually live in.
Advertise with Prime Time 24Reach readers on the ward they actually live in.
Advertise with Prime Time 24
Comments
No comments yet. Be the first.